
Frequency Response Analyzers are devices used for measuring how a system responds to inputs in terms of magnitude and phase as a function of frequency. For example, if we feed a linear system with a sine wave, its response will be of the same frequency at a certain magnitude, and if we double the amplitude of the input, the output will double as well.
To measure the frequency response of a system we feed it with certain test signals and compare the input and output. Common techniques for measuring the frequency response are:
- applying an impulse and measuring the so-called impulse response
- sending a signal with constant amplitude and sweeping across the frequency range we are measuring to observe how the amplitude and phase response change across frequencies
- applying a signal with a wide frequency spectrum
The responses we measure can be displayed in three different ways:
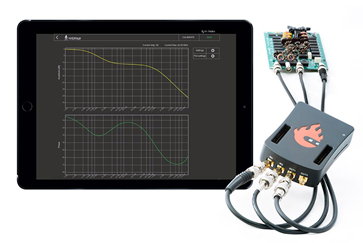
- Bode plot: plotting magnitude and phase as functions of frequency on two separate plots
- Nyquist plot: plotting magnitude and phase on a single polar plot with frequency as a parameter
- Nichols plot: plotting magnitude and phase on a single rectangular plot with frequency as a parameter
Red Pitaya Bode Analyzer
The 'Bode Analyzer' application transforms Red Pitaya into an affordable frequency response analyzer which can measure the gain and phase of signals from 1Hz to 60MHz. You can access the web-based application through a web browser on your smartphone, tablet or PC.


