
In this video, M0JPI talks about a logic analyzer, what it is and the different types that exist. If you want to watch his video, scroll down to the bottom of the blog!

What's a logic analyzer?
A logic analyzer is useful for analyzing digital signals sent from on device to another. Lots of devices use serial bus architectures that come in different types. We will cover those later on. The logic analyzer is therefore really useful for checking what's happening on those communication lines and buses, making sure they are doing what you want them to be doing in a time you expected them to do it.
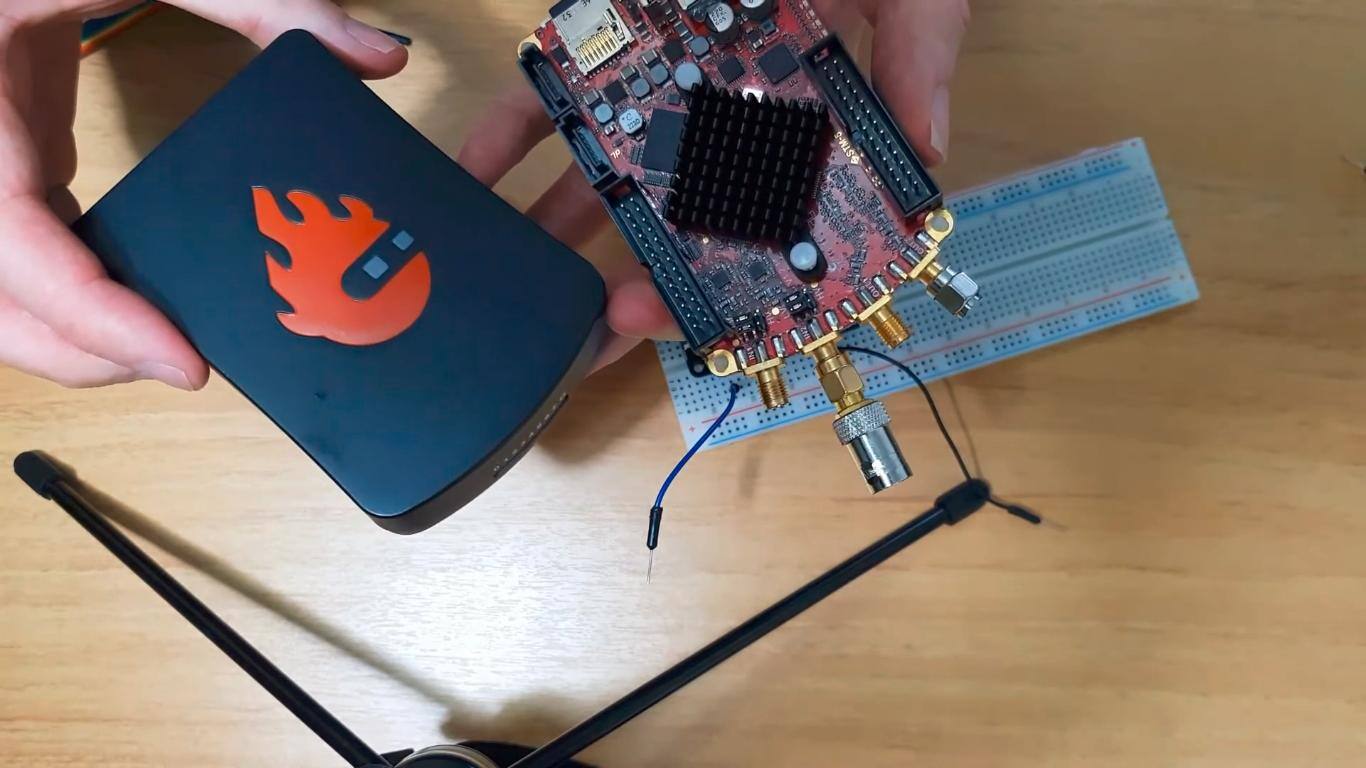
There is two different versions of Red Pitaya; the PRO version and the basic version.
The PRO version comes with with an accessory that provides buffer inputs to the Red Pitaya and a ribbon cable with lots of different connectors. On the ribbon cable you can find the female jumper connectors with a clip that clicks when you want to connect it do different pins or digital circuits. You can connect this to a standard jumper lead as well.
The basic version just includes ribbon cables and the clips, without the buffer accessory, so the ribbon cable connects directly on to Red Pitaya's expansion port! The advantage of the PRO version is that it provides a higher frequency. The basic version can sample up to 3Mhz input frequency while the PRO version can handle up to 50mhz input frequency with buffered inputs. This is useful because it can tolerate voltages from 2.5V to 5.0V, so its compatible with traditional 5.0V logic Arduino or you can use it for the more modern 3.3V for instance! The basic version can only be used on 3.3V.
You can find the specifications of the logic analyzer here. You must know that the basic logic analyzer only works on STEMlab 125-10 board and not other boards and it doesen't provide buffered inputs.
How to connect the basic?
You can connect the basic version directly to the expansion header. The black goes to the top and that leaves the first three pins next to the ribbon cable free (see picture below).
How to connect the PRO version:
First, we want to connect the buffer accessory to the board using the

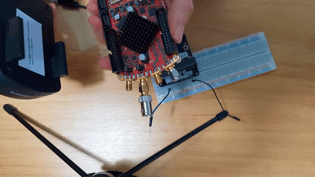
Check the connectors!
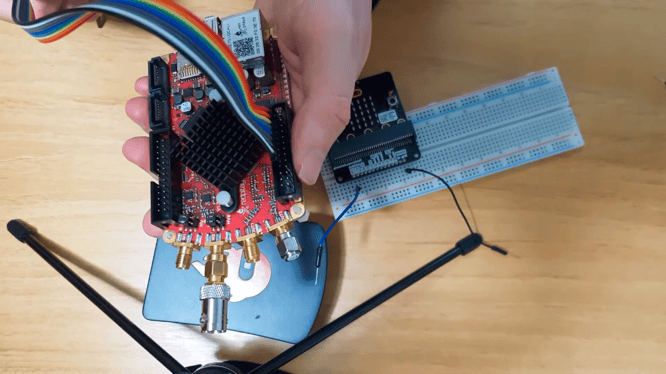
Be careful lining up the expansion headers with the pins on the Red Pitaya board (see 3rd picture) as they may not line up properly. It wont damage the board, the setup just won't work properly!
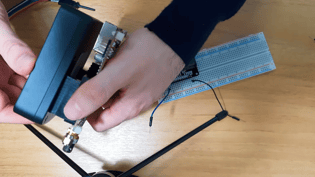
Then you want to connect the ribbon cables to the buffer accesory with the red line on 0, and the black line on G (ground).
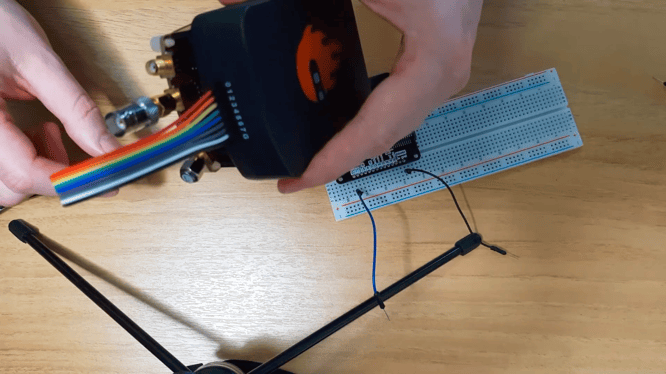
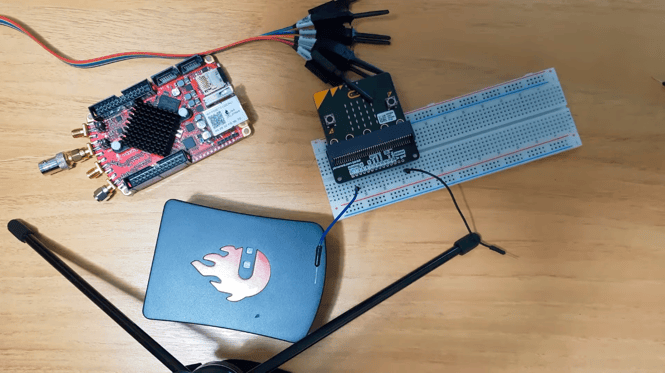
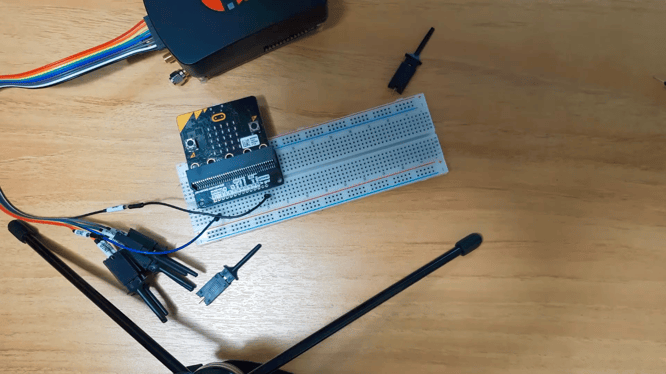
Then we connect the other end of the ribbon cable to the circuit on the test. In our case, its a BBC Micro bit. You can connect it directly or you can use the clips shown in the picture below.

We connect the jumper wire from the circuit (ground) to the black ribbon cable pin (ground). Then we connect the blue wire coming from 0 on the board with the first 0 red line pin on the ribbon cable (see picture below).
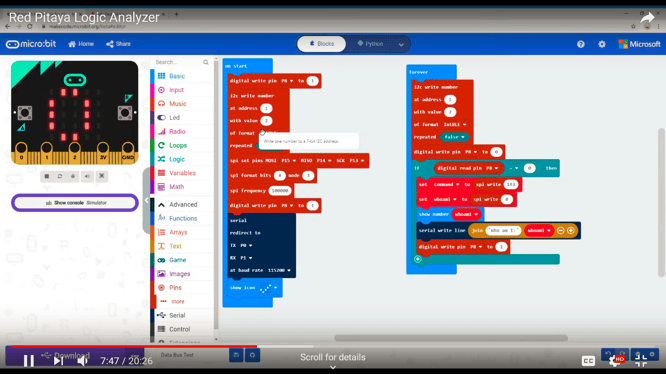
In this case, we will use the Red Pitaya PRO board that we set up. The board is already connected to the BBC Micro bit. To get the signal out of the Micro bit, M0JPI wrote some code in the Micro bit application.
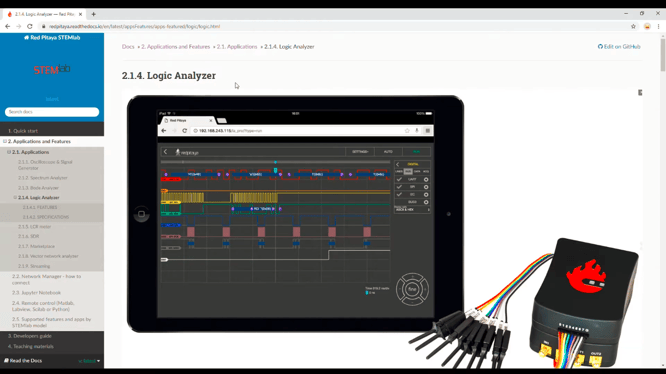
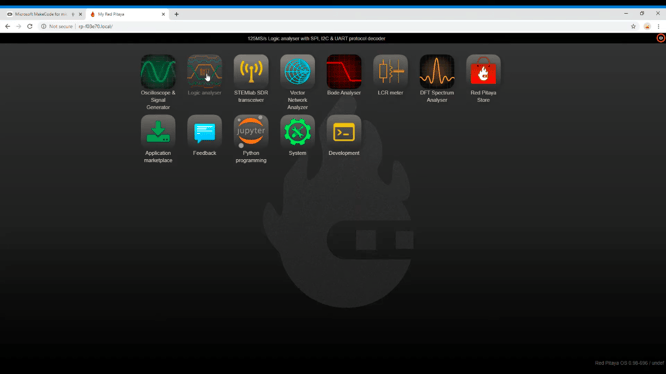
On Red Pitaya's local page, we click on the Logic analyzer icon. The main benefit of using the Logic analyzer is that you can read up to 8 different digital lines (the oscilloscope only supports 2), and you can also decode what is going on the serial lines.
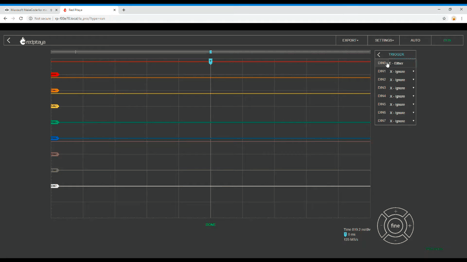
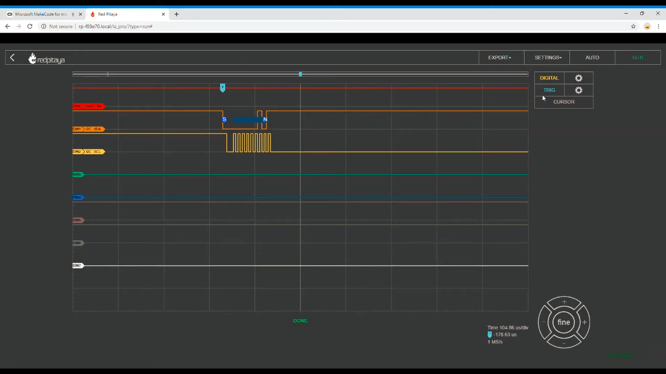
If we press Run in the application it won't give us any useful signals. We first have to go under TRIGGER (1st picture) and set the DIN0 (our red line coming from the buffer accessory) to Either. If we press Run now, we should be seeing a signal. Use the scaling tool on the bottom right (2nd picture) to zoom out the signal.
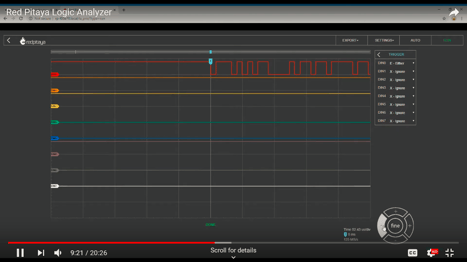
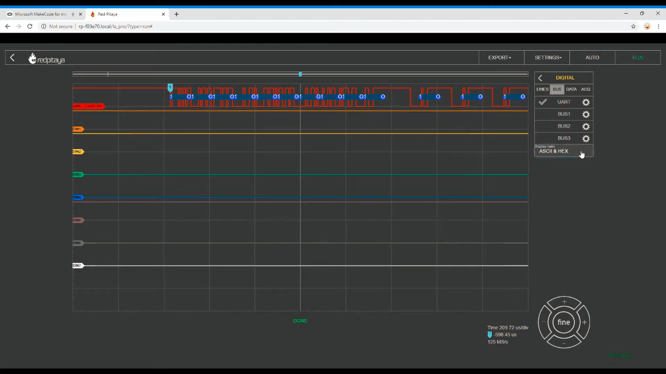
The signal that we received is the red line. If we want to analyze the signal, we can click DIGITAL on the top right (same place where TRIGGER settings were). Then we click BUS so we can set it up. In our case we will be using Serial UART. We select RX on the left, and DIN0 on the right. For the Baudrate, we enter the default (115200).
Now we can see the data more clearly. You have a choice for the data to be shown in ASCII or HEX.
There are more options. If we go under ACQUISITION, you can change it to different settings. The speed of the RP board is constrained by the speed of our Micro bit. If we reduce the sample rate per second we actually get more samples, because it will do one mega sample. So if we set it to one mega sample per second, it will save a whole second worth of data. If we went with maximum speed, it would save a lot less data.

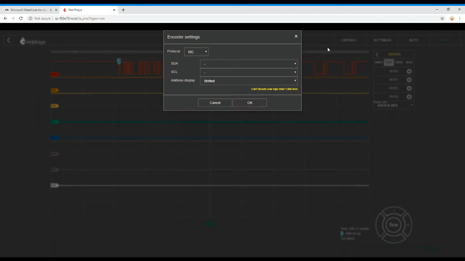
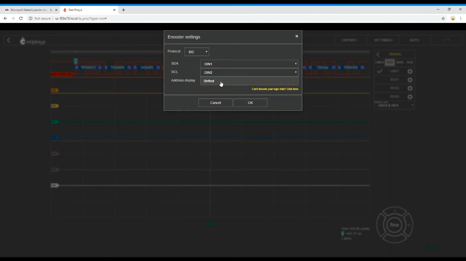
We can go on and set up different busses by clicking on the next bus settings icon shown in the picture below (left). Then we have to chose I2C for our I2C interface (picture on the bottom right). Then we should look at our board and check that SDA is set to DIN1 and SCL is set to DIN2 (settings shown on the bottom right picture). We can leave the Address Display settings to Shifted.
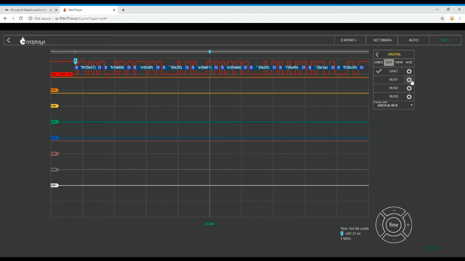
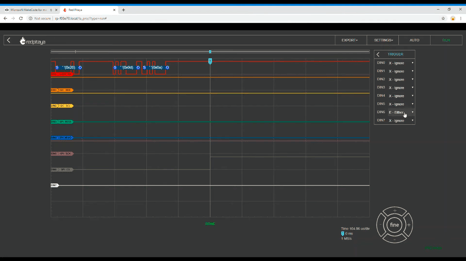
Another thing you can do, is set up more TRIGGER options. We can do that by setting DIN1 to Either. This way we can receive the data on the 2nd digital line. The data-set shown below is what you should be getting after clicking RUN on the top right of the Logic analyzer app.
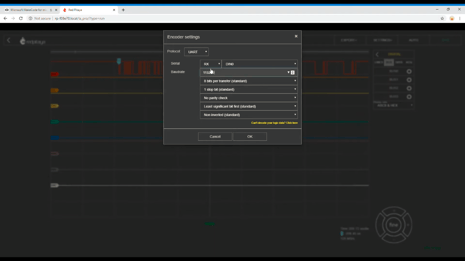
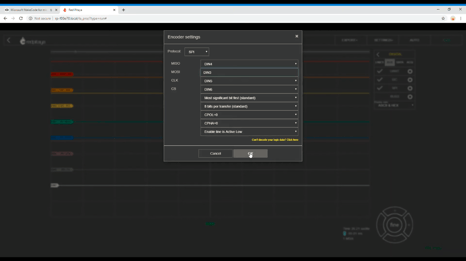
We can set up our 3rd protocol of our DIGITAL BUS settings; the SPI. The settings below are the ones M0JPI uses in his video. You can configure these however you want. When you are done, press OK. Before we run the test, we set the TRIGGER options again. In our case, we set DIN6 to EITHER (bottom right picture). M0JPI goes through various options of analyzing your signal with different data formats.
And there you go!
This is what a Logic analyzer is and how you can set it up using Red Pitaya. If you want to find out what's in the buffer accessory box, check out the end of the video where M0JPI takes it apart!


