
Laboratory material research is traditionally linked to bulky, high-precision equipment for precise analysis. Unfortunately, it is virtually impossible to take these devices into the field for “real-life” material testing. Increasingly smaller components with impressive performance characteristics are revolutionizing the world of field tests in general, enabling the development of handheld devices with amazing power-to-size ratios. As such, it is no wonder that the Lab-Tools has integrated a Red Pitaya unit into their Mk3 NMR Relaxation Spectrometer, since this Swiss Army Knife among FPGAs has always shown outstanding characteristics in RF signal generation and data capturing & processing, all at just the size of a credit card.
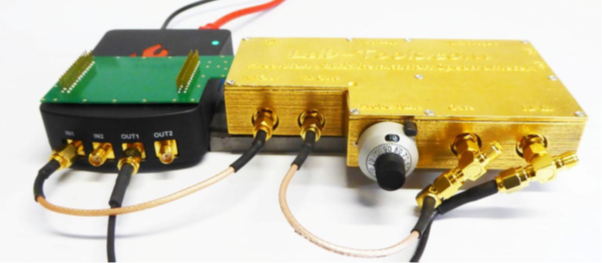
NMR – or Nuclear Magnetic Resonance – spectroscopy is a technology that superposes small high-frequency magnetic pulses on a strong, constant magnetic field. Nuclear spin variations then emit electromagnetic waves during a period – called “relaxation time” – after which they return to their normal state. The emitted signals are subsequently captured and processed for material analysis at the molecular level. Fig. 1 shows the setup of the Lab-Tools instrument, with the integrated Red Pitaya STEMlab unit.
Figure 1: Lab-Tools NMR Relaxation Spectrometer, with Red Pitaya unit on the left
A relatively new variant of this technique is the NMR Cryoporometry, capable of providing physical material data, such as mobility, stiffness, viscosity, and rigidity. It uses the Gibson-Thomson effect, where small crystals of a liquid in the pores of a test material melt at a lower temperature than the bulk material. This melting point depression is an indicator of the pore size, which, subsequently, is linked to the physical material’s properties. This technology can be used on samples that are liquid, waxy, porous, and polymer, or even on rigid materials such as brittle ice. Fig. 2 shows a test setup, where the sample is placed inside the permanent magnet, while sensors are connected to the Mk3 and the test device to a computer.
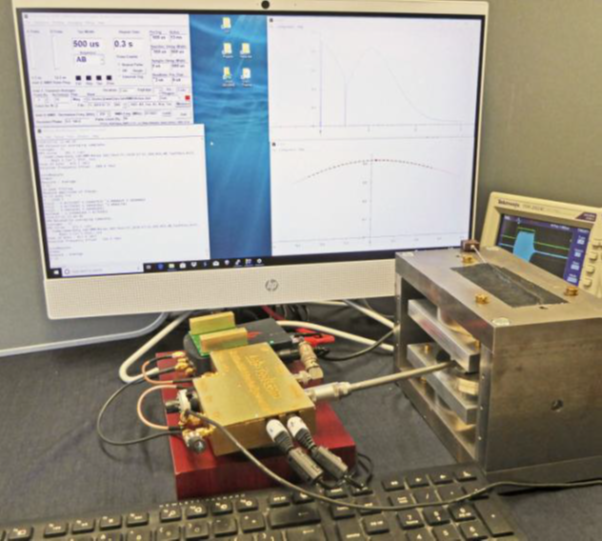
Figure 2: Lab-Tools Mk3 test setup
Understanding the key role of the Red Pitaya STEMlab 125-14 unit in this process is easy: its RF outputs provide the pulses for the “perturbation” field, superposed on the strong magnetic field, and pickup sensors then send their signals to the digital STEMlab inputs, where the high-frequency analog data is sampled into digital information, ready for real-time or post-processing. Custom software uses Graphic User Interfaces to provide the requested information. Some test examples are shown below.
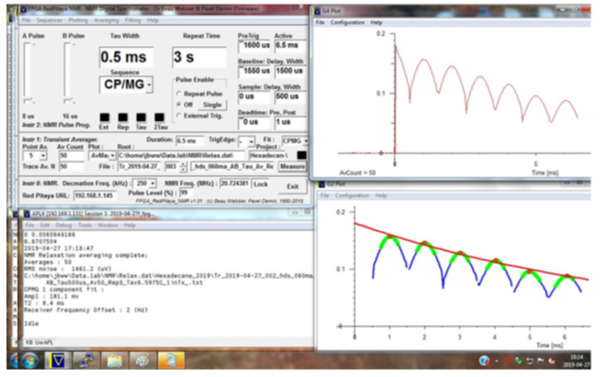
Figure 3: An example of an instrumental software front panel (Graphical User Interface) showing the averaged capture of a train of NMR echoes, to measure the T2 relaxation time of liquid hexadecane in the pores of a porous silica. The echo peaks are each polynomially fitted and then the decay of the peak maximum is exponentially fitted, with the results being reported during the measurement and logged to the file.
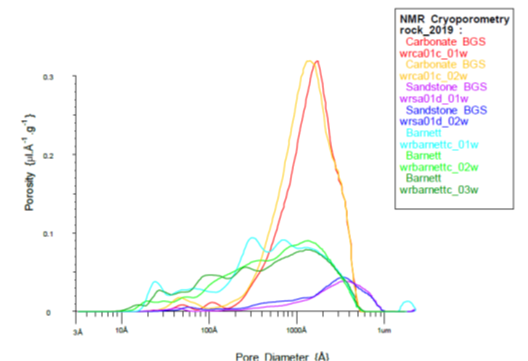
Figure 4: It shows repeated NMRC pore size distributions for Sandstone, Shale, and Carbonate porous rocks.
For the full article click here.


