Measuring System for Determining the Quality of LED Light
-
Posted by
 Red Pitaya Technical Editorial Team
, December 5, 2024

In the last few decades, the use of LED lights has evolved from colorful pilot lights on electronic boards and appliances to becoming the dominant technology in general lighting applications. Combining the warm light of incandescent bulbs with the energy-saving feature of cold fluorescent lamps, it surely has revolutionized the lighting industry. But research has also shown that certain lighting parameters can affect our physical as well as mental health and well-being. Just to name two, color temperature and spectral light distribution —the famous “blue light”— can interfere with melatonin production, disrupting sleep cycles and affecting circadian rhythms. And flickering caused by the fluctuation of the electrical current through the light bulb—even when not consciously observed— can contribute to eye strain, headaches, and visual discomfort, even migraines and seizures in some extreme cases.
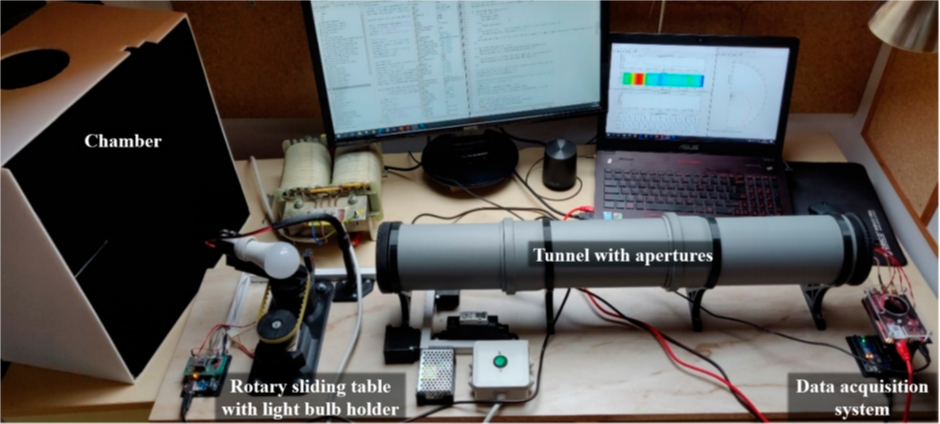
This observation led Matic Markovic and his colleagues from the university of Maribor to report on their Measuring System for Determining the Quality of LED Light Sources and an Overview of LED Light Bulbs for Household Use, after performing tests on 59 different commercial light bulbs from 37 manufacturers. In this work they tested the following parameters: fluctuations in the emitted luminous flux, AC current flowing into the LED bulb, illuminance and polar luminous intensity distribution, frequency spectrum and color spectrum. The physical elements of the experiment were mainly low-budget COTS components and self-made 3D-printed parts, and the setup can be seen in the figure below.


Figure 1: Experimental setup
The light bulb holder was mounted on a rotary table with a stepper motor, allowing the polar distribution light intensity measurement in 51 measurement steps over a 180° rotation, and placed in front of the measuring tunnel. This tunnel, including apertures of different diameters and blackened surfaces, was used as a light filter for the sensor, eliminating as much reflected light as possible. A longitudinal section of the assembly is shown in the figure below. A chamber with black inner surfaces, as seen in Fig. 1, was then placed over the light bulb and tunnel entrance to avoid any interference from ambient light.


Figure 2 Measuring tunnel
Finally, a Red Pitaya board and Arduino microcontroller were placed on a table (see the figure below) close to the VEML7700 photodiode to minimize cable length between the DAQ connections of the STEMlab unit and the optical sensor. The Red Pitaya device was then connected to MATLAB via an Ethernet connection to communicate information on the input signal, sampled via both inputs at 300 kHz and digitalized with a 16-bit resolution by the integrated DAC.


Figure 3 Red Pitaya board on the support table
The following figures show some test results with examples of a polar diagram for the angular light intensity, a time graph for electrical current and luminous flux, as well as the frequency domain signal analysis. Overall, the results show large variations between different bulbs, with fluctuations in light flux ranging between 0 and 82.4%, and deviations between announced and measured luminous flux values ranging from -0.3 to +47.4%.


Figure 4 Polar diagram for the angular light intensity distribution


Figure 5 Time graph for electrical current and luminous flux


Figure 6 Frequency domain signal analysis (0-500 Hz)
Since the purpose of this article is not to assess light bulb quality and the experiment was not conducted in a certified installation, we will not include any specific test results here. Nevertheless, the authors have successfully drawn attention to some of the potential negative effects on human health and well-being that come with LED lights, since our enthusiasm for new inventions and applications can sometimes cause us to overlook these things. And if only limited resources are available for initial research on the main parameters of interest, then you can be sure that Red Pitaya can deliver a valuable contribution to the results.
Authors: Matic Markovic , Andrej Orgulan and Primož Sukic, University of Maribor, Slovenia
About the Red Pitaya Team
The Red Pitaya Technical Editorial Team is a cross-functional group of technical communicators and product specialists. By synthesizing insights from our hardware developers and global research partners, we provide verified, high-value content that bridges the gap between open-source innovation and industrial-grade precision.
Our mission is to make advanced instrumentation accessible to engineers, researchers, and educators worldwide.


