Detecting and Locating Underground Wires with Red Pitaya
-
Posted by
 Red Pitaya Technical Editorial Team
, February 27, 2023
Linear Current Sensing for Detecting and Locating Underground Structures, performed by Fridon Shubitidze et al.
When looking around, we see how cities keep getting bigger and denser, adding one construction layer on top of the other. What the eye can’t see, though, is the network of underground infrastructure that’s necessary to meet all the buildings’ needs with regard to power, water, sewage removal, and so on. Moreover, not all the parts of this network are mapped as precisely as we would like, especially since some of this infrastructure dates back more than a century, which is why the detection, location and characterization of underground pipes, cables and tunnels remain a fascinating challenge. This issue becomes even more pressing when we consider the deterioration of many these elements due to their age, creating a wide range of environmental and energy security hazards.
Some of the technologies involved in subsurface infrastructure detection include the use of RF tomography, ground-penetrating radar, seismic methods, synthetic aperture radar, microgravity, electromagnetic gradiometers, and low-frequency and transient electromagnetic induction (EMI) sensing. The detection range of most of these methods, however, is rather limited (around 1 m). Previous research, which aimed at increasing this range for underground linear conductors such as wires and pipes, examined the use of induced non-solenoidal current excitations on conducting elements. The main objective of a recent study, Linear Current Sensing for Detecting and Locating Underground Structures, performed by Fridon Shubitidze et al. (2022), was the detection of finite-sized – long and thin – subsurface wires, buried in a layered structure and subject to arbitrary excitation.
Broadband EMI sensing of thin, long underground conductors is done via an alternating primary electromagnetic field, generated by an external source above the ground. The primary electromagnetic field penetrates the soil and impinges on the target, creating eddy and/or linear currents inside the conducting soil and in/on the metallic conductor (see Fig. 1).
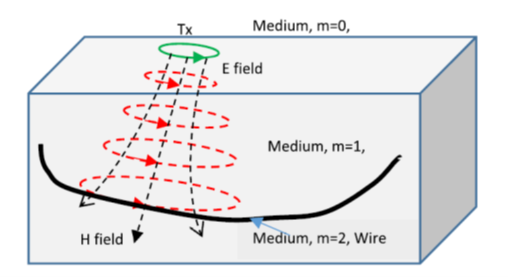 Figure 1: Finite wire in a homogenous half-space and time-harmonic EM fields, produced by a transmitter (Fridon Shubitidze et al., 2022)
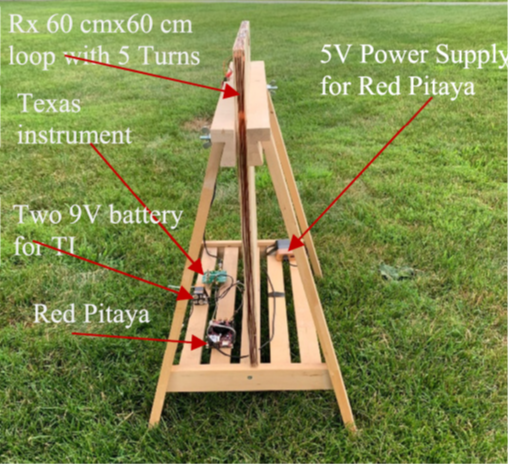
The secondary electromagnetic field generated by these currents can be detected by a suitable sensor. Two types of sensors were used during the tests in this study. The first one was a single-axis model, consisting of a 5-turn rectangular pickup coil, connected with the two input channels of the familiar Red Pitaya STEMlab 125-14 unit (see Figure 2) for data acquisition.

Figure 2: Single-axis sensor setup, including a STEMlab 125-14, a TI amplifier, and 60 x 60 cm pickup coil (Fridon Shubitidze et al., 2022)
The second setup included a triaxial sensor for improved subsurface wire detection and localization that also allowed estimating wire orientation (see Figure 3). The probe was made of three 15 cm diameter coil pairs, oriented in the x-, y- and z-axes, with the pairs 1.68 m apart along the y-axis.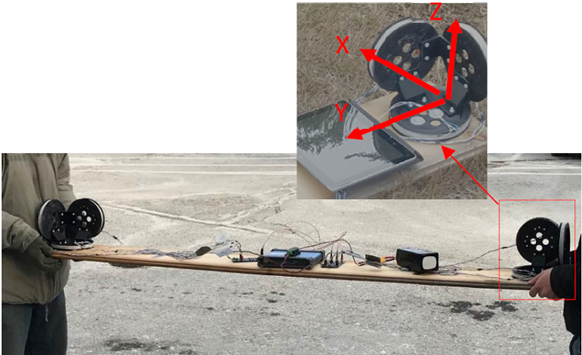
Figure 3: Triaxial gradiometer sensing system (Fridon Shubitidze et al., 2022)
Tests were performed with different setups and at different frequencies to study low (0 Hz to 100 kHz) and high (100 kHz to 10 MHz) frequency responses. These frequencies were obviously not of an order of magnitude that would cause any trouble for the STEMlab unit’s 125 Mbps sample rate. The figure below shows measurement values for induced linear electric currents along a 100 m long copper wire in a test setup where the Tx coil was placed 1 m above the surface, with 4 m offset in the y-axis. The graphs on the left show the results at 500 kHz, while those on the right reflect the values measured at 1500 kHz. The Tx coil position was 10 m away from the wire extremity for the top row, against 50 m (i.e., in the center) for the bottom row. Three different wire dispositions were recorded: 1) placed in free space (blue lines); 2) buried in conducting soil with a conductivity of 10−3 [S/m] (red line); and 3) in soil with a 10−2 [S/m] conductivity (green line). The results show that the maximum excitation coincides with the longitudinal Tx coil position for subsurface conductors, as well as for conductors in free space at non-resonant frequencies. The maximum excitation for a free conductor does not depend on the Tx coil position for (near-)resonant frequencies (around 1500 kHz, where the wire length equals λ/2).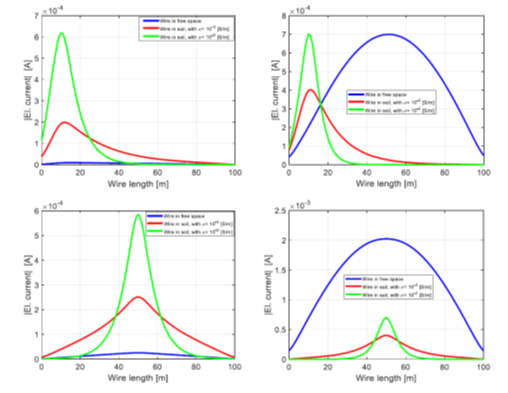
Figure 4: Secondary current for different conductor configurations, sensor positions and primary frequencies (Fridon Shubitidze et al., 2022)
In the second phase, an EMG was used to reduce the influence of soil conductivity, and a more elaborate setup was developed with a wire, buried at variable depth, with the sensing device moving along six survey lines, perpendicular to the wire orientation. As expected, the data show that the conductor generated a wider response at greater depth while, inversely, the signal became narrower when the track was shallower. Analysis of the collected data resulted in a comparative graph between actual and estimated wire depth, showing excellent agreement, especially at smaller depths (see the figure below).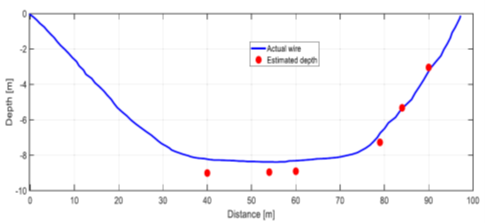
Figure 5: Real vs. estimated conductor depth (Fridon Shubitidze et al., 2022)
This experiment is obviously a small (but decisive) step towards the real-time detection of underground infrastructure. Many challenges still lie ahead, especially when thinking of realistic situations in urban environments with continuously overlapping and crisscrossing conducting elements. Nevertheless, when the day finally arrives that a construction worker can simply scan a building site with a handheld device when looking for buried cables and conductors, it would come as no surprise to see that the device was getting its input from a Red Pitaya unit.
Please find the full article written by Fridon Shubitidze, an Associate Professor from the Thayer School of Engineering at Dartmouth in Hanover, NH, US, available for reading here.
About the Red Pitaya Team
The Red Pitaya Technical Editorial Team is a cross-functional group of technical communicators and product specialists. By synthesizing insights from our hardware developers and global research partners, we provide verified, high-value content that bridges the gap between open-source innovation and industrial-grade precision.
Our mission is to make advanced instrumentation accessible to engineers, researchers, and educators worldwide.


