Beam diagnostics are essential for particle accelerator operations, enhancing physics experiment accuracy. The COoler SYnchrotron (COSY) at Forschungszentrum Jülich employs various beam instrumentation systems for real-time data processing, crucial for safe and efficient performance. This blog highlights recent enhancements in the Beam Loss Monitor (BLM), focusing on the use of field programmable gate arrays (FPGAs) for rapid data processing and integration into the COSY's Experimental Physics and Industrial Control System (EPICS). It also discusses the development of Graphical User Interfaces (GUIs) using EPICS variables and Control System Studio (CSS) for accessing and utilizing archived data.
The Heart of COSY’s Diagnostics
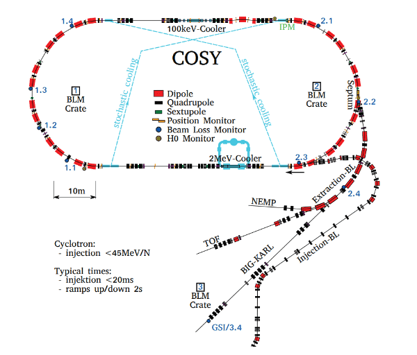
Figure 1: COSY elements: red, black, and smaller dark green blocks - magnets, blue circles - BLM detectors, green circles - H0 detectors (for neutral particles from electron cooling)
The Jülich COSY particle accelerator, functioning for proton or deuteron beams within 45-2880MeV, offers features like stochastic and electron cooling, and variable storage times ranging from seconds to hours. Its adaptable beam optics render it a prime research venue for various physics projects, including FAIR project studies, detector tests, and preparation for electric dipole moment (EDM) experiments. However, these characteristics also complicate the monitoring of beam parameters, such as the beam loss rate.
Innovation in Action: The Beam Loss Monitor (BLM)
The Beam Loss Monitor (BLM) system tracks particle loss from the beam orbit, crucial for machine adjustment and operation. In COSY, it comprises 9 radiation detectors. Each BLM crate follows a signal flow: particles generate light in the scintillator, converted to analog signals by the photomultiplier, then digitized by Red Pitaya (DAQ), and finally published to the EPICS network from the IOC.
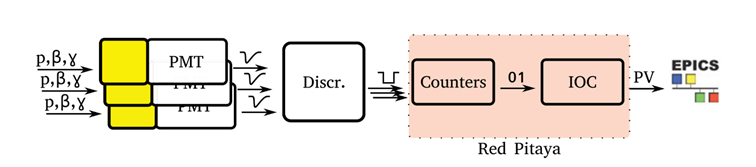
Figure 2: BLM signal flow scheme: particles produce light in the scintillator, which is then converted to analogue elec[1]trical signals in the photomultiplier; these are discriminated and then digitized by the Red Pitaya (DAQ); the counts are collected and published to the EPICS [2] network from the IOC.
Technological Backbone: Hardware and Data Acquisition
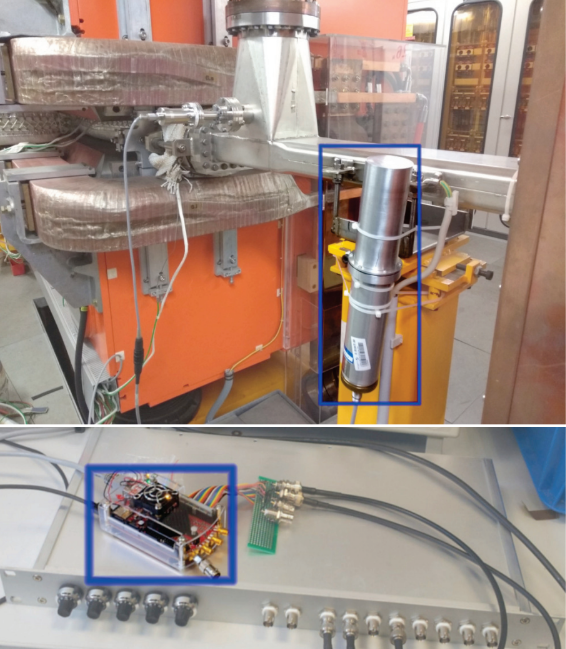
Radiation detectors, comprising encapsulated scintillating material coupled with photomultiplier tubes, were calibrated using radioactive sources and positioned along the ring at probable or confirmed loss sites. Additional detector installations are in the pipeline. Each BLM crate includes modules for PMT high-voltage and preamplifier voltage supply, alongside a discriminator module developed at Forschungszentrum Jülich. These discriminators handle both positive and negative detector pulse polarities with 2 mV granularity and offer 5 analog inputs. Data acquisition is carried out by a Red Pitaya board embedded in each discriminator module.

Figure 3: BLM hardware: the upper picture highlights one installed detector with scintillator and photomultiplier tube inside; the lower picture highlights the Red Pitaya board on top of a custom made discriminator module (usually housing a single Red Pitaya).
Red Pitaya
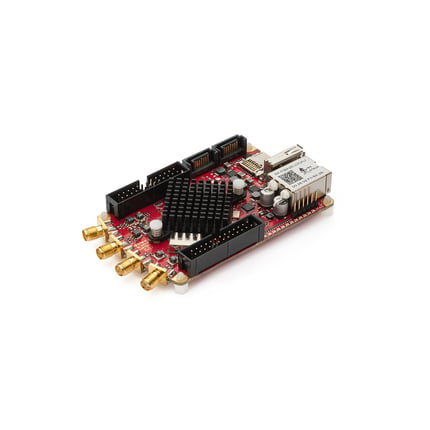
The Red Pitaya board is a cost-effective data acquisition platform equipped with a Xilinx Zynq-7010 SoC, two 14-bit ADCs, 16 GPIO pins, a dual-core ARM processor, 512 MB DDR3 RAM, SD card for the OS, and various peripherals.
Manufacturer-provided source code for the SoC FPGA firmware was modified to suit the BLM system's specific counting scheme and GPIO read-out. The FPGA enables simultaneous processing of two ADC inputs and up to 16 GPIO inputs without dead-time at a 125 MHz sampling rate.
Testing showed successful operation with signal input rates up to 30 MHz, primarily limited by the scintillator speed and signal pile-up.
The Red Pitaya comes with a compact 14MB Linux image containing an SSH server, nginx server, and busybox tools. EPICS 3.15 base was cross-compiled and integrated into the system to provide full EPICS server and Channel Access functionality. A custom IOC was developed to control the FPGA, process data, and serve BLM Process Variables (PVs) to network clients. NTP synchronization with a central COSY server ensures accurate data context with other diagnostics and control devices.
Client applications include a GUI and an Archiver appliance for recording relevant data from all IOCs, facilitating posterior data correlation.
Count taking scheme
The FPGA employs a count taking scheme to ensure consistent data delivery. Input signals and the clock are independently counted with 32-bit depth. Rising edges of signals increment corresponding counters, with storage and output triggered by rising edges of a control signal (keep_i). This asynchronous read-out, using additional registers, ensures precise rate estimation regardless of CPU or network latencies. Data is published at a 10Hz scan rate via EPICS PVs for regular monitoring.
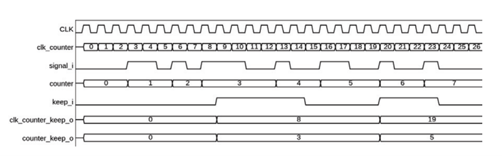
Figure 5: Count taking scheme: signal representations for a single input signal signal_i, clock CLK, and correspond[1]ing counter integers counter and clk_counter, keep in[1]put signal keep_i, and output integers counter_keep_o and clk_counter_keep_o. Rising edges of signal_i and CLK increment corresponding counters; rising edge of keep_i triggers storage and output of the integers in corre[1]sponding additional registers
For rapidly changing inputs, a Burst Mode is available, activated by an external trigger. This mode toggles the keep register at about 38.4kHz, capturing 105 values for 4 counters and the clock. Cached values are then published via a waveform PV every few seconds. The IOC-driven toggling accommodates typical operating system constraints, with sampling periods deviating by up to 1%, as depicted in Figure 6.
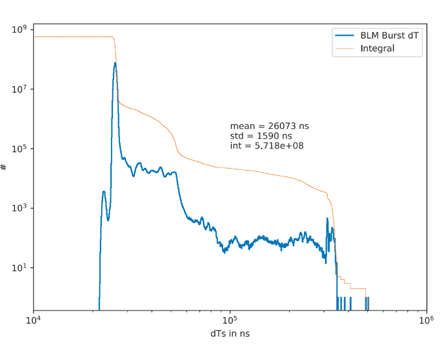
Figure 6: Measurement of the read-out rate in the burst mode; the clock PV waveform was recorded from the IOC and several measurements were stacked and histogrammed. The mean time slices dT is 26μs, with significantly longer (undesired) time slices of up to 500μs occur with less than 1% probability (integral)
Outlook
BLM Hardware:
Improvements planned for the beam loss monitor system include implementing FPGA-driven read-out with ample FIFOs and a DMA-like scheme for sub-μs rate sampling granularity. Additionally, integrating the charge under a pulse alongside pulse count is envisioned to address pulse pile-up and enhance resolution in energy deposit recognition.
BLM GUI:
Currently, the GUI only displays live values. Future enhancements aim to correlate beam losses with cycle time by plotting losses against cycle time. Additionally, functionality will be added to aggregate losses within a single cycle to calculate total losses.
Read more about the project here.
Recent Posts
-
 April 23, 2024
 -
 April 18, 2024
 -
 April 16, 2024
Related Posts