
A practical look at spectrum behavior in Class-D–style signals
Engineers working with audio DSP or power electronics already know the trade-offs in PWM-based systems. What this project does well is make those trade-offs measurable—using real hardware, not just simulation.
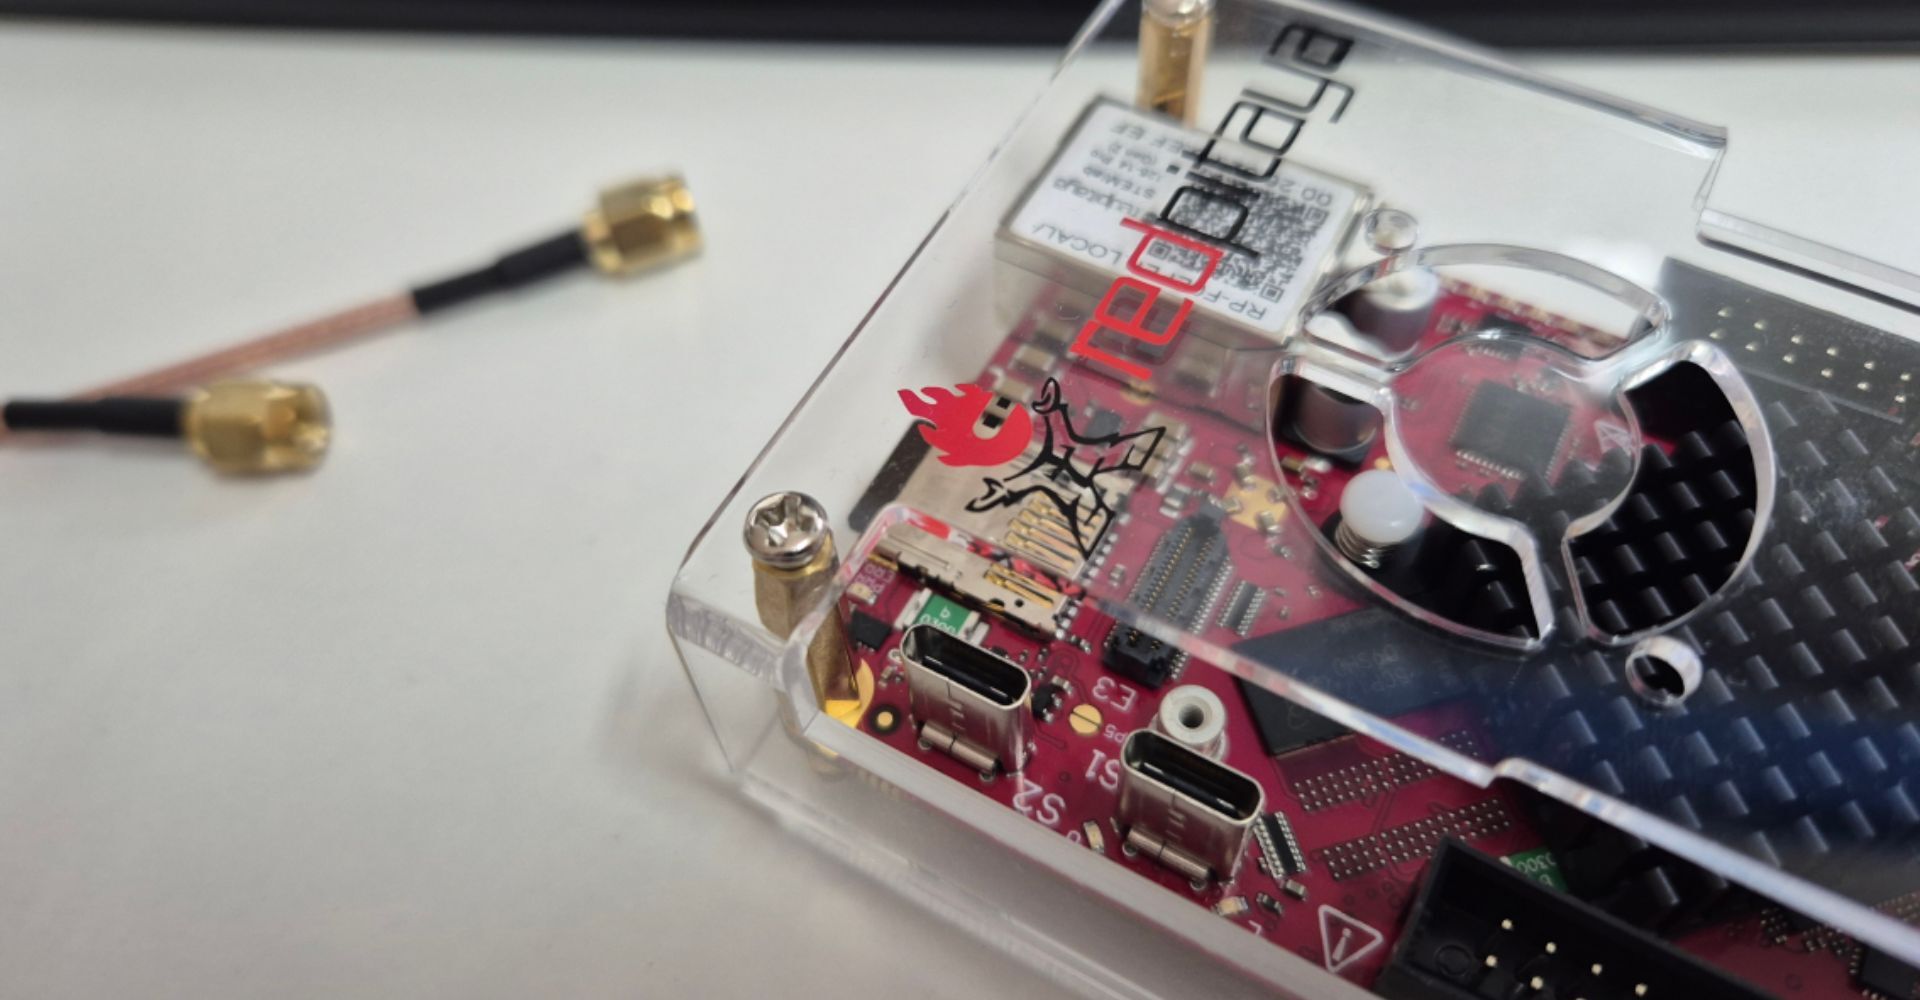
In a recent experiment published by Pablo Trujillo (ControlPaths), Red Pitaya STEMlab 125-14 PRO Gen 2 is used as a spectrum analyzer to evaluate how PWM modulation affects an audio signal across different resolutions. The setup combines FPGA signal generation with high-speed analog measurement, offering a compact but capable test bench for real-world validation.
The Setup: FPGA-Generated PWM, Measured in Hardware
The experiment pairs two platforms:
- Red Pitaya STEMlab 125-14 PRO Gen 2 → used for acquisition and spectral analysis
- Digilent Arty A7 → generates the PWM audio signal
A simple Verilog-based PWM modulator runs at 100 MHz on the FPGA, encoding a 3.9 kHz sine wave. The resulting signal is then captured and analyzed using Red Pitaya’s built-in spectrum analyzer.
This approach is notable because it replaces a traditional lab stack (signal generator + spectrum analyzer) with a single, software-defined instrument that is remotely accessible and FPGA-reconfigurable.
What’s Actually Being Tested?
The core question is familiar to anyone designing Class-D amplifiers:
How does PWM resolution affect spectral distribution—and what does that mean for filtering and audio quality?
PWM encoding introduces a carrier frequency and harmonic structure that must be filtered out to recover clean audio. The position of that carrier depends directly on resolution:
- 8-bit → ~390 kHz carrier
- 9-bit → ~195 kHz
- 10-bit → ~97 kHz
Higher resolution improves amplitude granularity, but compresses the spectral spacing—bringing switching artifacts closer to the audio band.
What the Measurements Show
Using Red Pitaya as a spectrum analyzer makes the trade-offs immediately visible:
- 8-bit PWM
- Carrier far from audio band
- Easier filtering
- Lower amplitude resolution
- 9-bit PWM
- Balanced compromise
- Harmonics begin entering mid-frequency range
- 10-bit PWM
- Better resolution (1024 levels)
- Carrier dangerously close to audio band
- Requires higher-order filtering (LC, multi-stage)
The key takeaway is not theoretical—it is measurable:
Resolution and filtering complexity are tightly coupled design parameters.
Time-domain observations reinforce this. Lower carrier frequencies (higher resolution) introduce visible distortion after reconstruction, especially if filtering is insufficient.

Why Red Pitaya Gen 2 Matters Here
This type of experiment highlights where Red Pitaya STEMlab Gen 2 fits in an engineering workflow:
- Combines oscilloscope, spectrum analyzer, and signal generator in one device
- Provides 125 MS/s ADC/DAC for mid-frequency analog work
- Enables FPGA-level customization for DSP pipelines
- Supports SCPI, Python, and browser-based control
For DSP, embedded, or FPGA engineers, it effectively bridges the gap between development board and lab instrumentation.
Practical Implications for Engineers
If you are working on:
- Class-D amplifier design
- Audio DSP pipelines
- FPGA-based signal processing
- Mixed-signal validation
this experiment reinforces a few operational realities:
- Simulation alone is insufficient for PWM systems
- Spectral verification must include real switching artifacts
- Hardware-in-the-loop testing exposes filter limitations early
- Tooling flexibility (FPGA + measurement) reduces iteration time
Read the Full Technical Breakdown
This summary only covers the key insights. The original article goes deeper into:
- Verilog PWM implementation
- Spectrum plots across resolutions
- FPGA workflow and deployment
- Detailed measurement methodology
Read the full article here:
Red Pitaya Gen 2: Analysis of an audio signal modulated using PWM | controlpaths.com
FAQ
What is PWM audio modulation used for?
Primarily in Class-D amplifiers, where efficiency is achieved by switching instead of linear amplification.
Why does PWM resolution affect frequency spectrum?
Because resolution determines the division of the system clock, directly setting the carrier frequency and harmonic spacing.
Can Red Pitaya replace a spectrum analyzer?
For many applications up to ~50 MHz bandwidth, yes. It provides sufficient resolution and flexibility for embedded and DSP work.
Why not just simulate PWM behavior?
Simulation cannot capture analog effects such as switching noise, non-ideal filtering, and real hardware constraints.
Is this relevant beyond audio systems?
Yes. The same principles apply to motor control, power electronics, and any PWM-based control system.


