
Both the concept of the speed of light and ways of measuring it intuitively seem topics beyond our grasp, beyond thinking of pointing lasers at the moon. In fact, the first attempts to measure it in the 17th century were related to the observation of planets and their moons, but nowadays, with the help of a Red Pitaya unit, you can perform such an experiment with 0.5% accuracy at home, as explained by Che-Chung Chou and his co-authors at Feng Chia University in Taichung, Taiwan, in their 2023 article A tabletop experiment for speed of light measurement using a Red Pitaya STEMlab board.
Since the first estimations of the value of the speed of light, a wide range of methods have been used to come to the officially established value of c = 299,792.458 m/s. The method used for this experiment involves phase shift measurement, comparing the phase shift between an amplitude-modulated beam that has travelled a known distance and a reference signal. Thanks to the development of microelectronics hardware and open-source software, setups for this kind of experiment can be designed with affordable components, such as the STEMlab 125-10 board and low-cost laser diode modules, replacing the conventional and expensive laboratory instruments. An added advantage of using the Red Pitaya FPGA is its versatility, allowing it to simultaneously perform the role of more than one instrument.
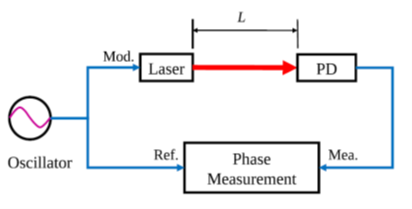
The basic configuration of the setup can be seen in Figure 1 below, with an oscillator providing a light signal that is split into a modulation signal (Mod.) and a reference signal (Ref.). The modulation signal is emitted by a laser and, after travelling distance L, picked up by a photodiode (PD) for phase comparison with the reference.
 Figure 1 Basic configuration of the phase shift measurement method
The experimental setup, which can be fitted physically on a 60 by 90 cm kitchen table, is outlined in Figure 2 below. It shows the Red Pitaya unit (RP) delivering the output signal Out1 to the power splitter PS that sends half of its power as the RF signal to bias tee BT1, and the other half as the reference signal back to the STEMlab. BT1 combines the RF signal with a 5 Vdc bias voltage (also supplied by the RP board) to power and modulate the laser module DL. The optical part of the setup consists of four mirrors M1 to M4 (with M3 and M4 in a precision-machined optical breadboard) and two irises, I1 and I2. Counting the number N of the mounting holes between M3 and M4 allows accurate calculation of the optical path difference DL. The double-pass uncertainty of DL is around 0.2%. To reduce additional error of DL due to the tilted angle of the mirror, a right-angle mirror M5 is placed to reflect the return laser beam into photodiode PD, sending its RF signal to a second bias tee. BT2 then forwards the AC component of the signal to one of the analog inputs of the STEMlab.
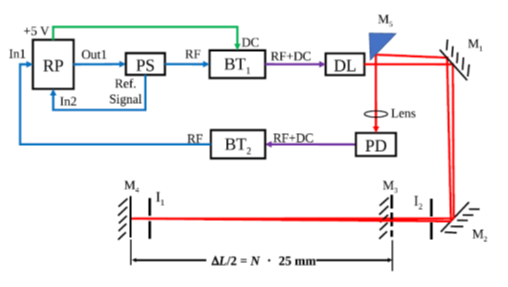 Figure 2 Experimental setup for speed-of-light measurement
For the actual experiment, M3 is first flipped downwards for beam path alignment with M4, then upwards again to align the beam, reflected by M3. Phase measurement is then done by successively reflecting the beam with M4 and M3.
The task of the Red Pitaya unit doesn’t stop at simply generating and collecting the RF signals: the built-in Bode analyzer of the STEMlab125 is also configured for phase and amplitude measurement. A typical result of this exercise can be seen in Figure 3, with the yellow and green curves indicating the frequency responses of signal amplitude and phase for a 10-40 MHz sweep, and Figure 4 showing the resulting phase shift between both reflection modes. 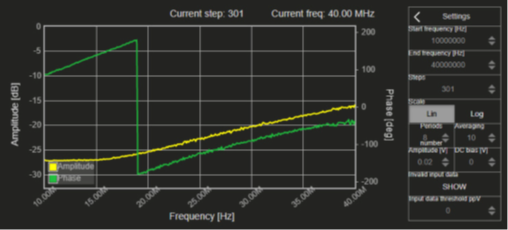
Figure 3 Frequency response curves, measured with the STEMlab's Bode analyzer 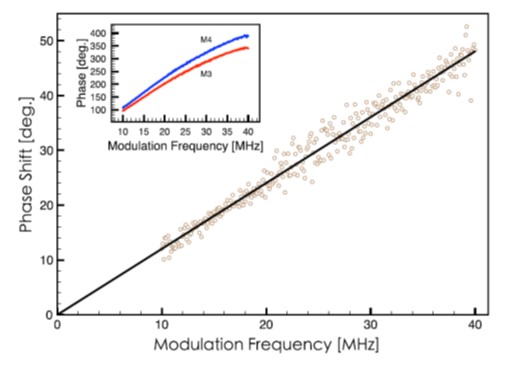
Figure 4 Best fit of the phase shift over the 10-40 MHz modulation range
The final calculation result of the speed of light in this experiment is reflected in the value 0 of the plot in Figure 5, showing that the uncertainty area around the obtained result still gives an expected error, but an error of less than 0.5% with respect to the official in-air value of 299,704.08 m/s. The other values and corresponding uncertainties reflect the results obtained through other methods, demonstrating that this experiment is able to provide solid data. Not bad for a tabletop setup. But what else would you expect when a Red Pitaya is involved?
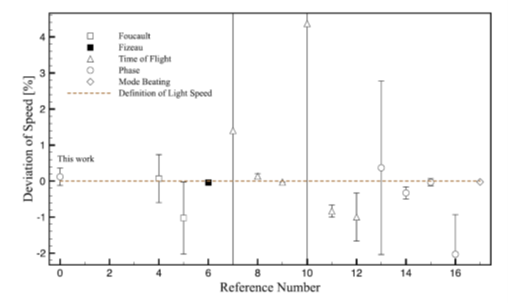 Figure 5 Final test result, compared to other test methods
This article is written with reference to the article “A tabletop experiment for speed of light measurement using a Red Pitaya STEMlab board” by Che-Chung Chou, Shi-Yu Hsaio, Jun-Zhi Feng, Tyson Lin, and Sheng-Hua Lu from the Department of Photonics at Feng Chia University in Taichung, Taiwan.


