
In a previous blog article (https://content.redpitaya.com/blog/a-compact-optical-frequency-reference-for-nanosatellites), we described how Aaron Strangfeld and his coauthors integrated a STEMLab125-14 unit in a Rb-based optical frequency reference for a nanosatellite application. This project was designed for a specific purpose, but since the reliable operation of mobile systems relies heavily on compact, robust and autonomous optical references, it was also a first step towards an updated model for general use. This new article describes how some of the same authors from the Humboldt University in Berlin optimized their design and fitted it in a handy, small-sized casing for plug-and-play use. Both projects have an important element in common: the trust placed in Red Pitaya technology for controlling and monitoring many of the device’s processes, a choice that is increasingly common among researchers who need to fit a lot of functionality into a small volume at a reasonable price.
Atomic optical frequency references (AOFR) can be used in a wide range of applications: ground- and space-based earth observation and navigation, calibration of optical instruments, references for laser systems for trace-gas detection or optical communication. Herein, an ideal system is fully autonomous, meaning there is no interaction with or interference from the hosting system, which leads to the need for physical and functional isolation. Overall design challenges include mechanical and thermal engineering, the integration of a reliable laser source, optical engineering of a spectroscopy unit and the development of suitable low-noise driving electronics.
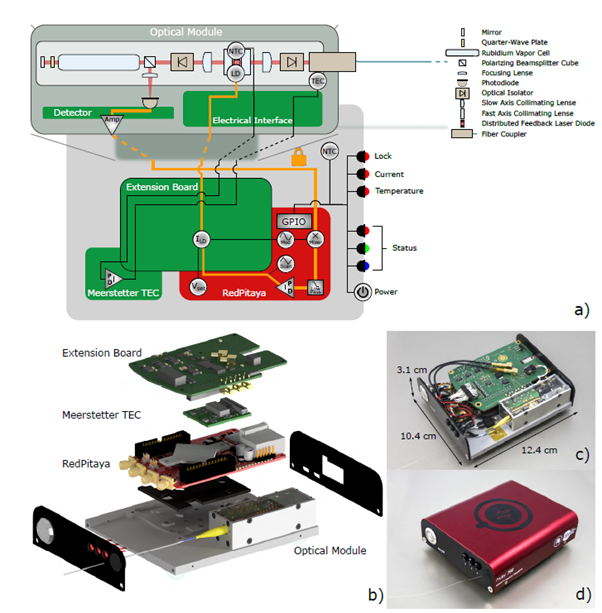
The result of this project was a standalone plug-and-play optical frequency reference, based on FM spectroscopy of a distributed feedback (FDB) laser diode, using the D2-transition in warm Rb-vapor at 780 nm, with single-button activation, in a hand-sized module, generating 6 mW of frequency-stabilized light. The module includes dedicated software, a control and lock-in amplification unit, temperature controller and current driver.
Figure 1 shows how all components are integrated, both functionally as physically, in a 12.4 x 10.4 x 3.1 cm3 assembly, with the STEMLab unit at the center. In order to achieve a compact design, the FPGA was stripped of all its unused connectors, while its heatsink was replaced with a flat aluminum sheet. The other main components include an optical module, a Meerstetter TEC-1092 temperature controller, a custom extension board and an integrated current driver. The aluminum casing provides passive cooling for the entire module.

Fig. 1 System overview: (a) Simplified functional diagram; (b) Exploded view, with the STEMLab at the center; (c) Assembled view without cover; (d) Complete system with cover
Linien-based software, running on the Red Pitaya, is responsible for controller temperature monitoring, setpoint control, driving current and device temperature monitoring, current sweep and modulation signal generation, demodulation of the spectroscopy signal, 700 kHz bandwidth locking and front-panel LED control. There is a long list of tasks that need to be carried out simultaneously, but nothing the STEMLab can´t handle with ease.
Once assembled, the device is ready for connection to the network to be monitored, and simply pushing the main button starts the autonomous function mode for system parameter control and the selection of the transition to be locked on.
During tests of the module´s thermal behavior, warm-up cycles with frequency variations for different end temperatures, as seen in Figure 2, resulted in a dependence of 2.6 kHz/K, corresponding to a relative frequency deviation of 6.8 10-12 /K
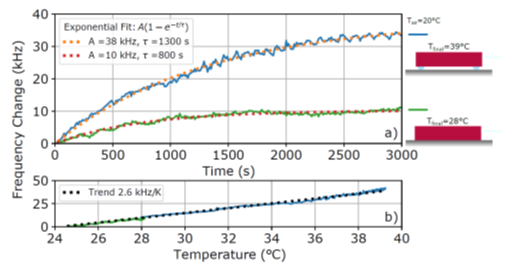
Fig. 2 Thermal behavior study
For optimization of the Allan deviation, an initial test to improve the signal-to-noise ratio by increasing the modulation amplitude led to an expected short-term improvement in stability for averaging times below 100 ms. Longer integration times resulted in deterioration of the τ−1/2 trend. The Allan deviation for averaging times between 100 ms and 10 s was thus addressed using a Bayesian optimizer. The corresponding graph in Figure 3 shows Allan deviation values of the new module (orange line) as a function of the averaging time, comparing it with the values for the first model, used for the nanosatellite (green line), for three measurement series with different measurement times and sampling rates. The result gives a 1.4 x 10⁻¹² Allan deviation for an averaging time of 1 s. Overall, the increase in frequency instability remains below 15% for averaging times up to 100 s.
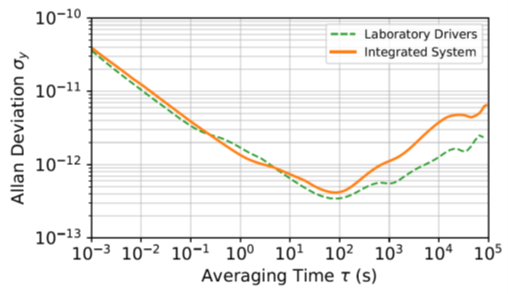
Fig. 3 Allan deviation of the optical system, driven by external laboratory drives, compared with the fully integrated system
The general conclusion of this experiment is that integrating the functionalities of a dedicated optical reference into a small, handheld, and general-purpose unit comes with a cost of a lower performance compared to a bigger system. However, at the same time it has resulted in a fully autonomous integrated AOFR, enabling user-friendly and portable access to frequency-stabilized light at 780 nm in a compact and cost-efficient design. Further refinements to boost performance and stability are already under investigation.


