When I started teaching digital signal processing, I found that the most difficult concept for students to grasp was how and why the analog signal's spectrum is repeated around all the integer multiples of the sampling frequency. To help them better understand this topic I prepared an exercise which demonstrates this phenomenon.
The most direct way to show the effects of the sampling process on the spectrum of a sampled signal is to sample a signal, reconstruct the signal using (an approximation of) Dirac impulses and measure the spectrum of the reconstructed signal.
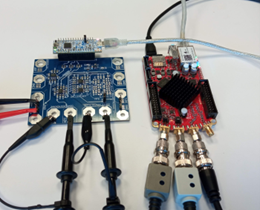
For the demonstration we need a signal source, a system with an ADC and a DAC, an oscilloscope and a spectrum analyzer. All of the required instruments can be replaced by a Red Pitaya device, but for us the critical instrument that it needed to replace was the spectrum analyzer, since a dedicated spectrum analyzer is very expensive, and using a Red Pitaya instead enabled us to prepare ten measurement setups for students.
The ADC/DAC system was implemented using the Nucleo G431 STM development board. The system samples the input signal with a frequency of 10 kS/s and reconstructs the signal with pulses, which last only 1/10 of the sampling period, thus creating an approximation of Dirac pulses. The pulse width and time between pulses can be adjusted using simple messages sent via a serial port to demonstrate the effect of pulse width and sampling frequency on the spectrum of the sampled signal.
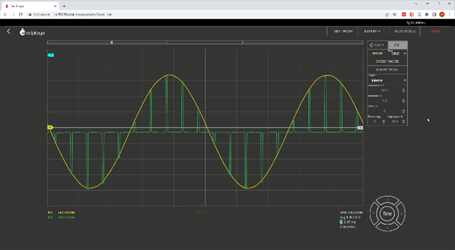
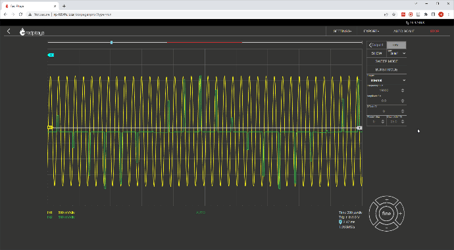
In the first part of the demonstration the students compare the input signal with the reconstructed signal while they increase the frequency of the signal from almost zero to well beyond the Nyquist frequency, so they can see firsthand how sampling of a signal with too high a frequency can generate the same discrete signal values as a signal within the Nyquist frequency range.
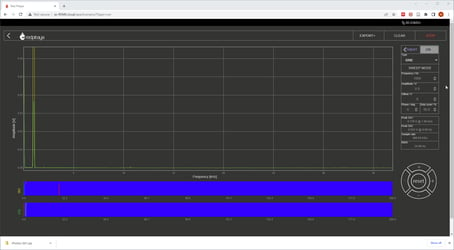
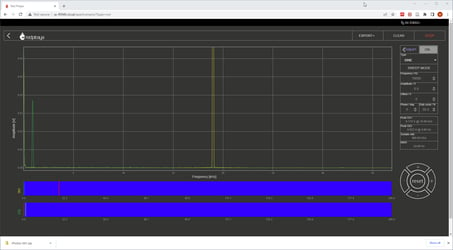
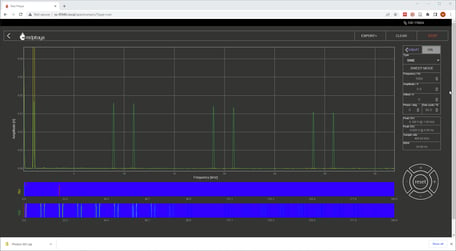
In the second part of the demonstration the students compare the spectrum of the input and output signals and again increase the frequency of the input signal beyond the Nyquist limit. This demonstration allows them to see how spectral components of the input signal at any frequency are replicated around all the sampling frequency multiples.
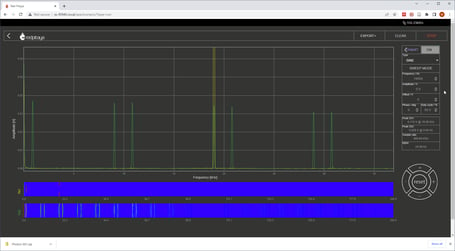
In the last part of the demonstration a reconstruction filter is added and the students have to compare the spectrums of the input signal and the signal at the output of the reconstruction filter. The frequency of the input signal is again increased from almost zero up to a few multiples of the sampling frequency, which should hopefully demonstrate that a discrete system cannot tell apart signals which are equally removed from any multiple of the sampling frequency.