
After some years of travelling with restrictions and additional rules, we have gone back to taking planes as if they were buses, without wondering too often what’s under the hood. For passengers this makes sense, as airplane maintenance is carried out following strict inspection protocols, and pilots have a battery of inflight monitoring devices at their disposal to watch over the health of their planes. The overall state of the turbo engine and the condition of its blades are critical aspects of air travel, not only from a safety perspective, but also when it comes to efficiency. Optimized performance leads to reductions in fuel consumption and atmospheric emissions, extended service life, and fewer maintenance requirements, issues of no small importance in a world where fossil fuel consumption is under increasing scrutiny.
In order not to interfere with performance, non-intrusive blade monitoring is key. In their study An Architecture for On-Line Measurement of the Tip Clearance and Time of Arrival of a Bladed Disk of an Aircraft Engine, José Miguel Gil-García and his co-authors at the University of the Basque Country investigated a method to achieve real-time readout of the blade tip/casing distance (TC, or tip clearance) and time interval between two consecutive blades (ToA, or time of arrival). Not only are these parameters of vital importance when analyzing blade condition, a smaller TC also leads to better performance, and ToA is used to study engine vibration amplitude and frequency.
Traditional test methods, using inductive, optic, capacitive, eddy current, magneto-resistive or microwave principles, require post-processing of previously measured data to deliver off-line results. On-line measurement offers the added benefit of operating in realistic conditions, knowing that the forces and accelerations during the flight are at the origin of transitory blade deformation. This article presents an electronic architecture for on-line TC and ToA monitoring, based on optical sensing. Relevant tests were performed on a rig, but the setup could easily be installed in a real plane.
The sensing architecture, including a trifurcated optical sensor and hardware processor, is scalable and allows simultaneous mounting of several sensors in different points. The principle of the optical sensor, installed in the engine casing, is shown in the figure below and consists of three legs (trifurcated): the central fiber emits light (yellow), while the two remaining legs capture reflected light.
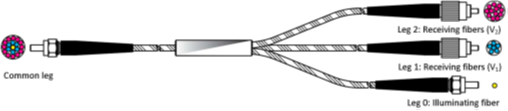


Figure 1: Trifurcated optical sensor
The optical signals (V1, V2) from blade reflection are captured by the Signal Conditioning Board (SCB) that sends electrical signals to the Red Pitaya STEMlab 125-14 unit, operating as a Processor and Interface Board, and digitizing the voltage signals at its renowned 125 Mbps sampling rate and 14-bit resolution (marked as FPGA in the figure below, showing the monitoring architecture).
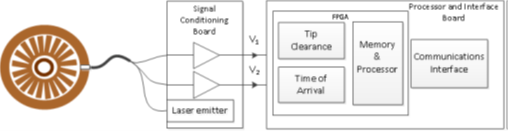 Figure 2: Bladed disk monitoring architecture
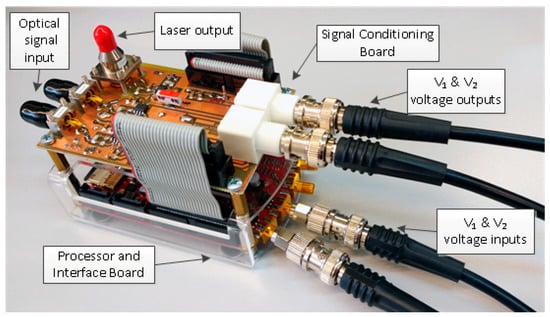
What the actual sensor setup looks like can be seen in the next image, with the familiar STEMlab shape and connectors recognizable in the lower part of the assembly.
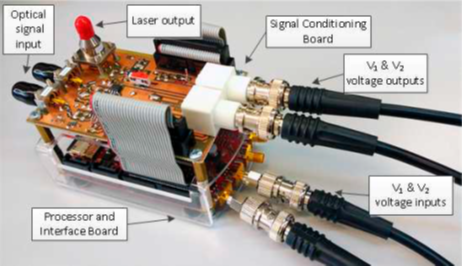 Figure 3: Electronic system for TC and ToA monitoring, including a STEMlab 125-14
The signals of the two receiving legs are shown in the graph below: V1 from an intermediate ring of fibers, V2 from the outer ring. The arrows in the picture, coinciding with the minimum values in reflected light, indicate when a blade passes in front of the sensor (“blade change”).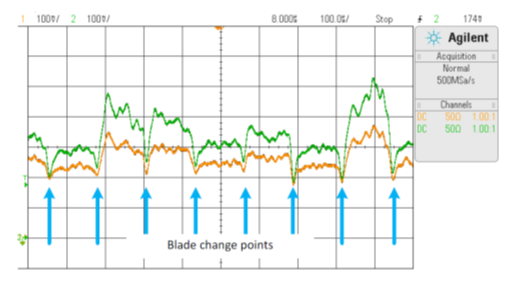
Figure 4: Optical signals indicating passing blades
In off-line mode, the digital information is captured within a time frame and the data submitted to a post-processing cycle. This method is more suited for sequential processing and global values, with results available after the time lapse required for acquisition and processing. The on-line method extracts values while signals are read, using pipeline processing techniques, and is specifically indicated for simultaneous processing of several sensors in parallel. Calculated values are instantly available in the memory for possible post-processing using BTT techniques, alarm generation, etc. The figure below shows a block diagram of TC and ToA processing, implemented in the STEMlab: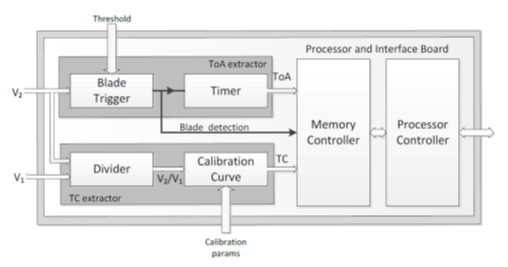
Figure 5: On-line calculation architecture for TC and ToA
The divider function eliminates the dependency of emitted light intensity. The ratio value, within a certain range, can be used as a calibration curve for the physical TC value:
TC = 351703625 − 22857 * V2/V
The ToA is extracted only from the V2 signal, having the largest dynamic range. Blade change confirmation is obtained via a specific algorithm, not simply using the minimum value (generating a shift, as can be seen in the graph below), making it possible to identify individual blades (given that the number of blades in the turbine is fixed).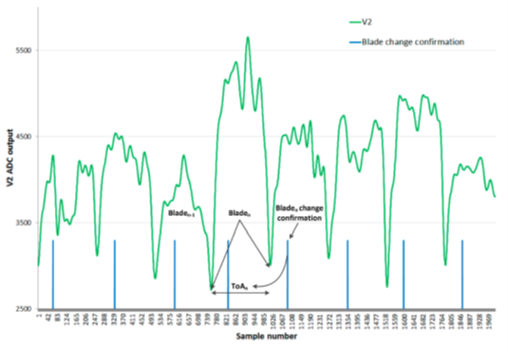
Figure 6: Change-of-blade confirmation
A life-size test was carried out in the CTA Aeronautical Technology Center in Miñano, Spain, where the sensors were assembled on a turbine rig with a 146-blade compressor disk (photographs of the test setup can be seen below). While the bladed disk was turning, the V1 and V2 signals were sampled at 2 Mbps. The results of the optical sensor were then processed for ten consecutive turns, calculating the minimum TC for every turn, as well as the average minimum TC over the 10 turns, and later compared with those of the commercial discharge sensor, traditionally used in the center. A worst-case deviation of 2.22% validated the optical sensing method.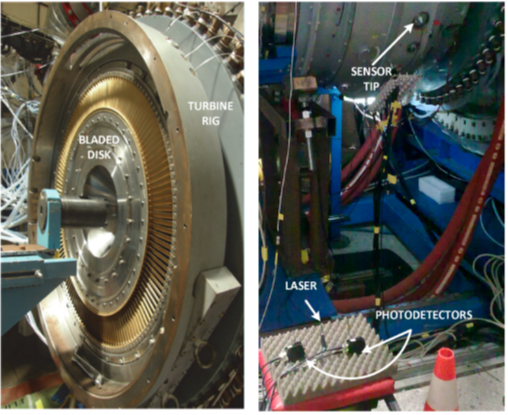
Figure 7: Optical sensors, mounted on turbine rig
After validating the test method, the deviation between off-line post-processed data and on-line readout was investigated during a subsequent set of tests. Data acquisition was done at three different stationary rotational speeds (3225, 4373 and 4608 rpm). The results obtained from both methods were coherent: the on-line process was able to detect all blade changes, the TC-deviations with respect to simulated values were only a few microns (compared with the 24mm sensor accuracy), and it delivered reliable continuous measurement of TC and ToA. The graph below shows TC values for 15 blades over 10 consecutive turns, making it clear that, for every individual blade, the deviations between turns show consistent behavior.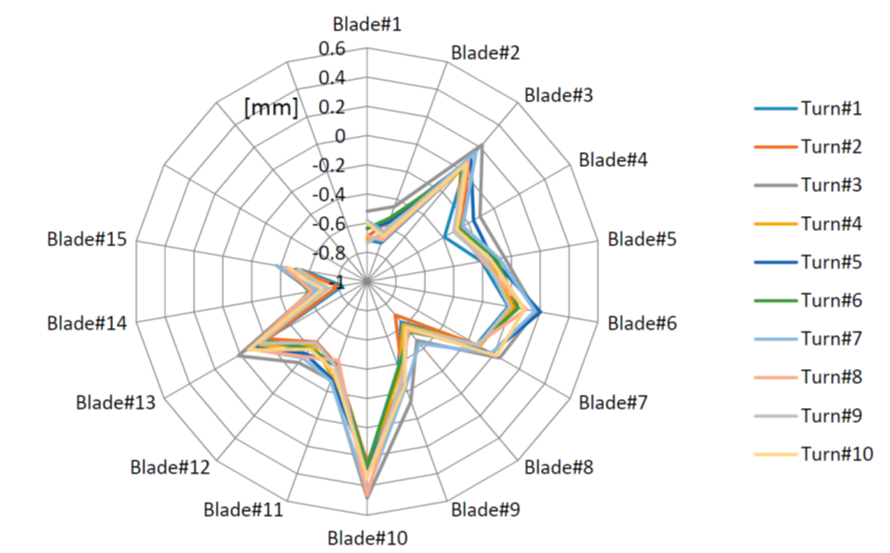
Figure 8: Deflections for 15 blades during 10 consecutive revolutions
This study demonstrated the validity of real-time monitoring of TC and ToA in realistic conditions using optical sensors. The method used to determine ToA automatically adapts to the rotation speed and eliminates dependency on light intensity. Combined with the pipeline approach and the STEMlab unit, this architecture is suited for on-line monitoring in realistic conditions. Accurate TC readout can drive design improvements, increasing efficiency without affecting flight safety. The hardware, including the FPGA, is robust and flexible, and a possible future increase in the channel count would lead to greater reliability and redundancy, thanks to the use of more sensors monitoring in parallel. And if mounting more sensors means installing more STEMlab units, there´s many more where this one came from. One thing’s for sure: their size will not weigh down the plane!
Read more about this here.


